This post is an exercise in chartsmanship. Nothing discussed herein should be taken as investment advice or as a recommendation regarding any particular investment vehicle or course of action. All statements herein are statements of subjective opinion and for information and entertainment purposes only. Seek a duly licensed professional for investment advice.
A lot has happened since the last time I discussed a supposed crystall ball predicting an impending crash of the U.S. stock market. Today, I saw another chart which is being used to support the claim that:
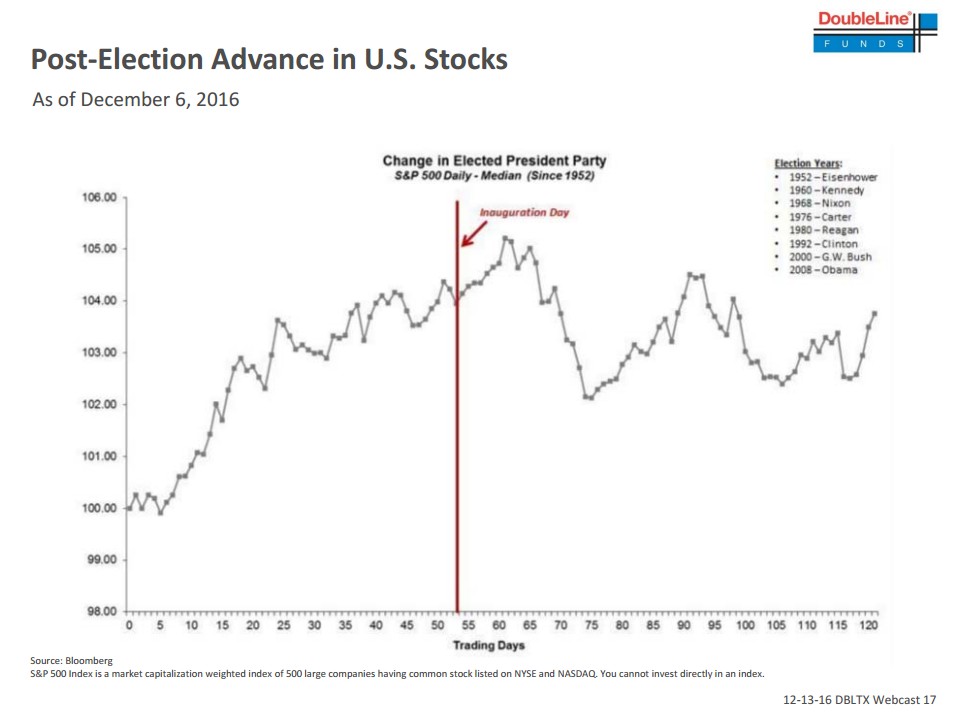
Stocks tend to strengthen in the two weeks after Inauguration Day, but one-month returns are typically negative
Here is the chart for reference:
This got me curious: What detail is being obscured by the use of the median per trading day across years? Separately, I also wanted to see if there were any interesting dynamics in the period leading up to each election.
To that end, I downloaded the daily levels of S&P500 from Yahoo! Finance. When you do that, you get a data file that is sorted in reverse chronological order. I wrote a quick Perl script to extract S&P500 levels from 100 trading days before to 100 trading days after the day of the U.S. Presidential Election for each presidential election year since 1950:
#!/usr/bin/env perl

use v5.24;
use warnings;
use feature 'signatures';
no warnings 'experimental::signatures';

use autouse 'Carp' => qw( croak );
use autouse 'YAML::XS' => qw( Dump );

use Const::Fast;

const my $SP500_FILE => 'SP500-daily-upto-20170113.csv';

const my %I => (
    election => 0,
    inauguration => 1,
);

const my %INTERVAL => (
    1952 => [ '1952-11-04', '1953-01-20' ],
    1956 => [ '1956-11-06', '1957-01-20' ],
    1960 => [ '1960-11-08', '1961-01-20' ],
    1964 => [ '1964-11-03', '1965-01-20' ],
    1968 => [ '1968-11-05', '1969-01-20' ],
    1972 => [ '1972-11-07', '1973-01-20' ],
    1976 => [ '1976-11-02', '1977-01-20' ],
    1980 => [ '1980-11-04', '1981-01-20' ],
    1984 => [ '1984-11-06', '1985-01-20' ],
    1988 => [ '1988-11-08', '1989-01-20' ],
    1992 => [ '1992-11-03', '1993-01-20' ],
    1996 => [ '1996-11-05', '1997-01-20' ],
    2000 => [ '2000-11-07', '2001-01-20' ],
    2004 => [ '2004-11-02', '2005-01-20' ],
    2008 => [ '2008-11-04', '2009-01-20' ],
    2012 => [ '2012-11-06', '2013-01-20' ],
    2016 => [ '2016-11-08', '2017-01-13' ],
);

const my %YEARS => (
    all => [ reverse map 1952 + 4 * $_, 0 .. 16 ],
    change => [ reverse 1952, 1960, 1968, 1976, 1980, 1992, 2000, 2008, 2016 ]
);

const my %TRADING_DAYS => (
    BEFORE => 100,
    AFTER => 100,
);

run( @ARGV ? $ARGV[0] : $SP500_FILE );

sub run( $sp500_file ) {
    my $data = read_data( $sp500_file, $YEARS{all} );

    print Dump $data;

    export_data(
        $data,
        $YEARS{all},
        "sp500-all-election-$TRADING_DAYS{BEFORE}-$TRADING_DAYS{AFTER}.tsv",
        [ -$TRADING_DAYS{BEFORE}, $TRADING_DAYS{AFTER} ],
    );

    export_data(
        $data,
        $YEARS{change},
        "sp500-change-election-$TRADING_DAYS{BEFORE}-$TRADING_DAYS{AFTER}.tsv",
        [ -$TRADING_DAYS{BEFORE}, $TRADING_DAYS{AFTER} ],
    );

    return;
}

sub export_data($data, $years, $filename, $period) {
    open my $fh, '>', $filename
        or croak "Failed to open '$filename': $!";

    # header
    say $fh join("\t", t => $years->@*);

    for my $i ( $period->[0] .. $period->[1] ) {
        my @obs = map {
            defined ? sprintf('%.4f', $_) : ''
        } map sp500_of($data->{$_}[$i - $period->[0]]), $years->@*;
        say $fh join("\t", $i, @obs);
    }

    close $fh
        or croak "Cannot close '$filename': $!";

    return;
}

sub read_data ($sp500_file, $years ) {
    my %data;
    open my $fh, '<', $sp500_file
        or croak "Cannot open '$sp500_file': $!";

    my $extractor = make_extractor( scalar <$fh> );

    for my $year ( $years->@* ) {
        $data{$year} = extract_sp500( $INTERVAL{$year}[$I{election}], $fh, $extractor );
        my $base = sp500_of($data{$year}->[$TRADING_DAYS{BEFORE}]); # election day
        for my $obs ( $data{$year}->@* ) {
            if (defined(my $sp500 = sp500_of($obs))) {
                sp500_of($obs, $sp500/$base);
            }
        }
    }

    close $fh
        or croak "Cannot close '$sp500_file': $!";

    return \%data;
}

sub make_extractor( $header ) {
    trim_inplace( $header );

    my @header = split /,/, $header;

    my @i = grep $header[$_] eq 'Date', 0 .. $#header;
    push @i, grep $header[$_] eq 'Close', ($i[-1] + 1) .. $#header;

    return sub ($row) {
        trim_inplace( $row );
        return [ (split /,/, $row)[@i] ];
    };
}

sub trim_inplace {
    $_[0] =~ s/^\s+//;
    $_[0] =~ s/\s+\z//;
    return;
}

sub date_of { $_[0]->[0] }

sub sp500_of {
    if ( @_ == 1 ) {
        return $_[0]->[1];
    } elsif ( @_ == 2 ) {
        $_[0]->[1] = $_[1];
        return;
    } else {
        croak "Too many arguments: '@_'";
    }
}

sub extract_sp500( $election_date, $fh, $extractor ) {
    my ($year) = split /-/, $election_date, 2;

    my $lo_date = sprintf '%d-06-01', $year;
    my $hi_date = sprintf '%d-04-30', $year + 1;

    my @data;

    while (my $row = <$fh>) {
        my $obs = $extractor->($row);
        if ( date_of($obs) le $hi_date ) {
            unshift @data, $obs;
        }
        # Markets were closed on November 2, 1976
        # http://archives.chicagotribune.com/1976/11/02/page/53/article/wall-street-pre-election-gains-small
        last if date_of($obs) le $election_date;
    }
    @data = @data[0 .. $TRADING_DAYS{AFTER}];

    for (1 .. $TRADING_DAYS{BEFORE}) {
        my $row = <$fh>;
        defined($row)
            or croak "Failed to read from data file: $!";
        unshift @data, $extractor->($row);
    }

    return \@data;
}
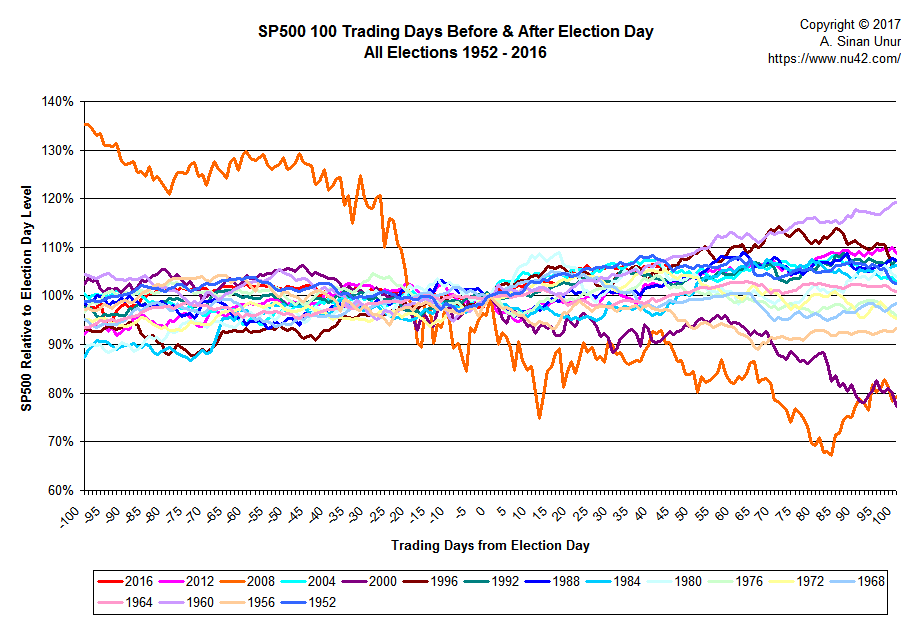
Note that I normalized the S&P500 levels relative to the level on election (or the trading day before if markets were closed on election day that year). First, I plotted the series for every election:
Clearly, there is considerable variability, but most of it is being suppressed by the huge movement in the series for 2008. 100 trading days before the election of President Obama, on June 13, 2008, S&P500 was at 1,341.8. On election that year, S&P500 was down to 971.3, and 100 trading days after the election, on March 31, 2009, it closed at 790.9 points representing a 59% drop over the course of the 201 trading days.
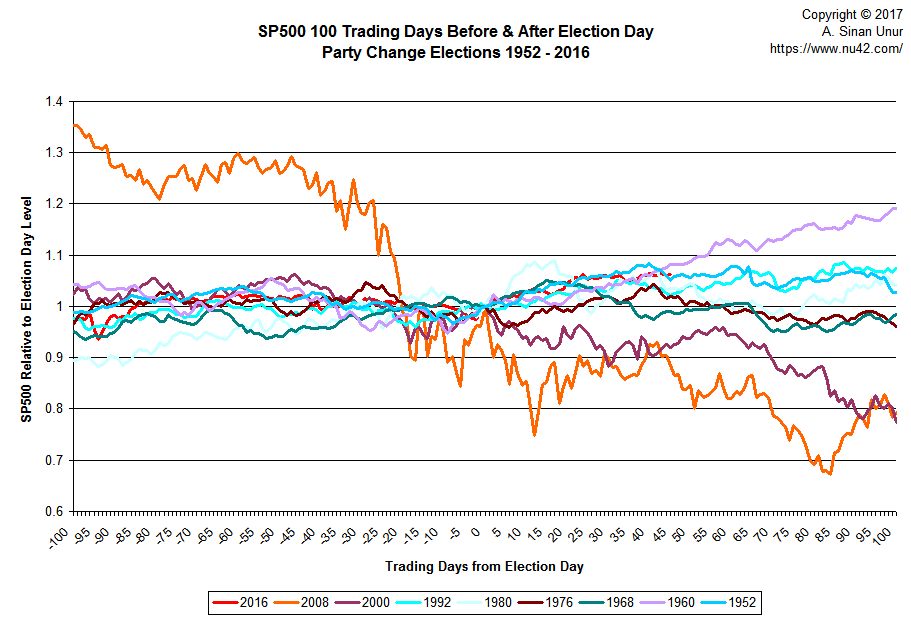
To get a little bit more clarity, I decided to only plot the series for the elections where the party holding the presidency changed: 1952, 1960, 1968, 1976, 1980, 1992, 2000, 2008, and 2016 (thus, using the same years as those used in the MarketWatch story):
If you squint hard, three series stand out: 1960, 2000, and 2008. 1960 stands out because it is the only series that looks like it is still on a increasing trajectory 100 days after the election. Both 2000 and 2008 stand out because those are the two cases where S&P500 was down by about 20% 100 days out from the election.
Kennedy’s election was a couple of years after the recession of 1957–58 whereas both Bush and Obama took office right around the times the technology and housing bubbles, respectively, were bursting. Another president who took office after a recession was Clinton whose election happened in 1992 following the July 1990–March 1991 recession. We may want to keep him in mind as well while trying to reduce the visual clutter in the chart.
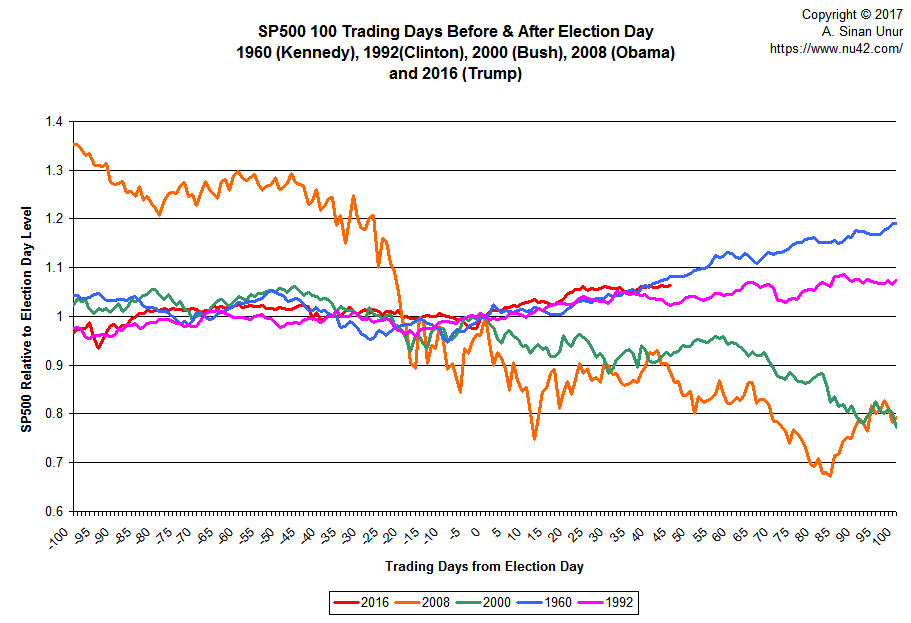
Here is the final iteration of the graph, focusing solely on the 1960, 1992, 2000, 2008, and 2016 elections:
So, if you look at the chart from just the right™ angle, it kinda sorta looks like S&P500’s behavior during the time period surrounding the 2016 is more similar to its behavior in 1960 and 1992 than it is to its behavior in 2000 and 2008.
Let’s take a look at correlations among years, ignoring 2016:
. corr(y2008-y1952)
(obs=201)

      |    y2008    y2000    y1992    y1980    y1976    y1968    y1960    y1952
-------------+------------------------------------------------------------------------
y2008 |   1.0000
y2000 |   0.8606   1.0000
y1992 |  -0.7609  -0.8083   1.0000
y1980 |  -0.7884  -0.6565   0.5719   1.0000
y1976 |   0.4471   0.4083  -0.2469  -0.1885   1.0000
y1968 |  -0.4539  -0.1891   0.1338   0.6011  -0.0596   1.0000
y1960 |  -0.5771  -0.7355   0.7994   0.2305  -0.3997  -0.2801   1.0000
y1952 |  -0.5441  -0.5861   0.8131   0.4384   0.0769   0.1094   0.6958   1.0000
So, S&P500’s behavior during the period surrounding President Obama’s election is positively correlated with its behavior during the same period around the elections of Presidents Bush and Carter, and negatively correlated with its behavior during the elections of Clinton, Reagan, Nixon, Kennedy, and Eisenhower. This, in and of itself, is probably an interesting observation.
The future is unknowable. However, we can ask how the behavior of S&P500 we have observed so far around Trump’s election relates to its behavior during the corresponding periods around the presidents mentioned above. Here are the correlations:
. corr(y2016-y1952)
(obs=146)

      |    y2016    y2008    y2000    y1992    y1980    y1976    y1968    y1960    y1952
-------------+---------------------------------------------------------------------------------
y2016 |   1.0000
y2008 |  -0.5251   1.0000
y2000 |  -0.5629   0.8895   1.0000
y1992 |   0.8445  -0.5840  -0.5974   1.0000
y1980 |   0.6254  -0.8726  -0.7949   0.6306   1.0000
y1976 |   0.2781   0.2398   0.0344   0.2442  -0.1151   1.0000
y1968 |   0.4590  -0.8561  -0.7343   0.5256   0.7329  -0.2825   1.0000
y1960 |   0.3772   0.0333  -0.1057   0.3305  -0.0739   0.1179  -0.2437   1.0000
y1952 |   0.8402  -0.3043  -0.4568   0.8050   0.3733   0.4203   0.2343   0.6367   1.0000
So far, S&P500’s behavior during the period surrounding Trump’s election is negatively correlated with its behavior during the same period surrounding the elections of Presidents Obama and Bush. It is positively correlated with its behavior during the elections of Presidents Clinton, Reagan, Carter, Nixon, Kennedy, and Eisenhower. The strongest correlations are between the current period and the corresponding periods surrounding the elections of Clinton, Reagan, and Eisenhower.
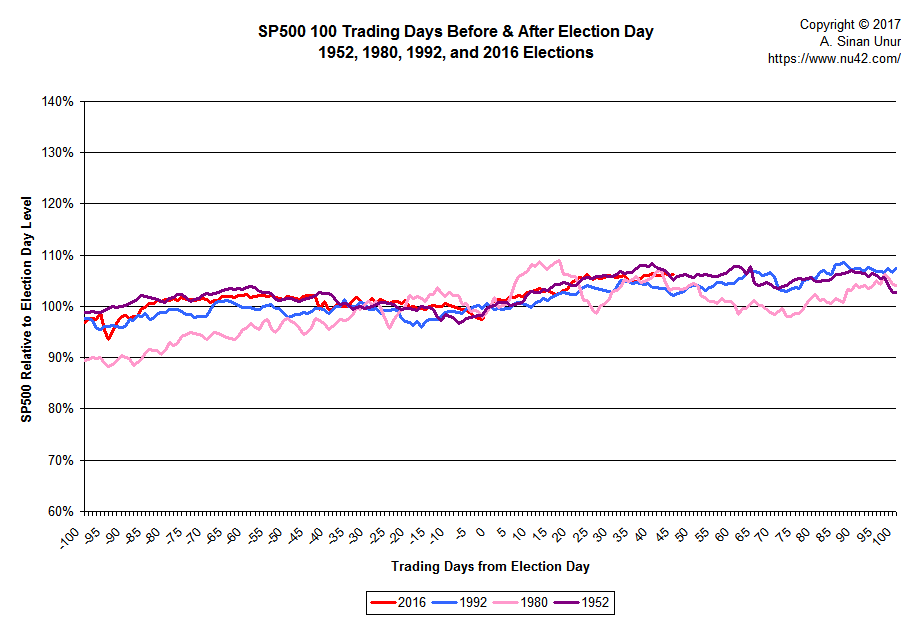
Limiting our chart only to those series, here’s what we have:
A hundred days from Eisenhower’s election, S&P500 was 2.6% higher. It was 4.1% higher 100 days after Reagan’s election, and up a whopping 7.4% 100 days after Clinton’s election.
Does this chart mean S&P500 on April 4, 2017 will be up somewhere between 2,186–2,287?
Of course not … remember the future has not been written yet. For all anyone knows, S&P500 may crash back down to 900 or reach for the skies at 4,000.
The motivation of this post was a chart that was constructed to support a specific point of view that
U.S. stocks have rallied since the election, but it’s time for investors to start thinking about getting out, possibly timed for President-elect Donald Trump’s inauguration, Morgan Stanley said.
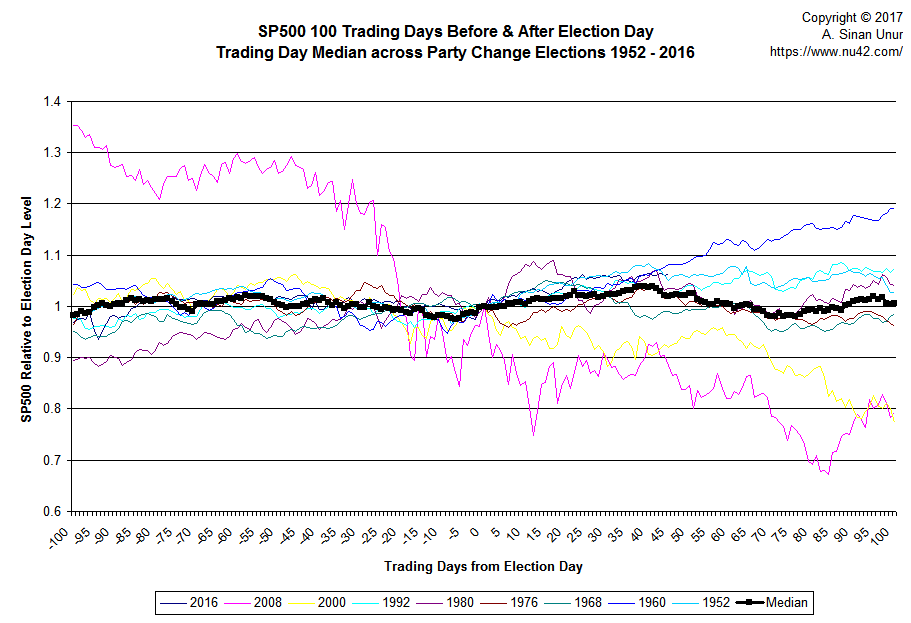
In fact, there may be other reasons to expect the future is not going to be very rosy, but the chart I showed in the beginning of this post is not the reason. Aggregating the information contained individual series with different dynamics mushes around all the variability and hides interesting patterns and relationships as can be seen in the following chart:
Yup, if you look only at the median, the conclusion is <sarcasm>obvious</sarcasm>:
S&P500 100 trading days out of the election day will be 0.57% higher than its level on election day—around 2,142 points which is the point being made in the MarketWatch article. Too bad there is no change election 100 days out of which the S&P 500 was virtually unchanged. It varied between a loss of almost 23% (after Bush’s election in 2000) to a gain of more than 19% (after Kennedy’s election) with the smallest loss being 1.5% (after Nixon’s election) and the smallest gain being 2.6% (after Eisenhower’s election).
